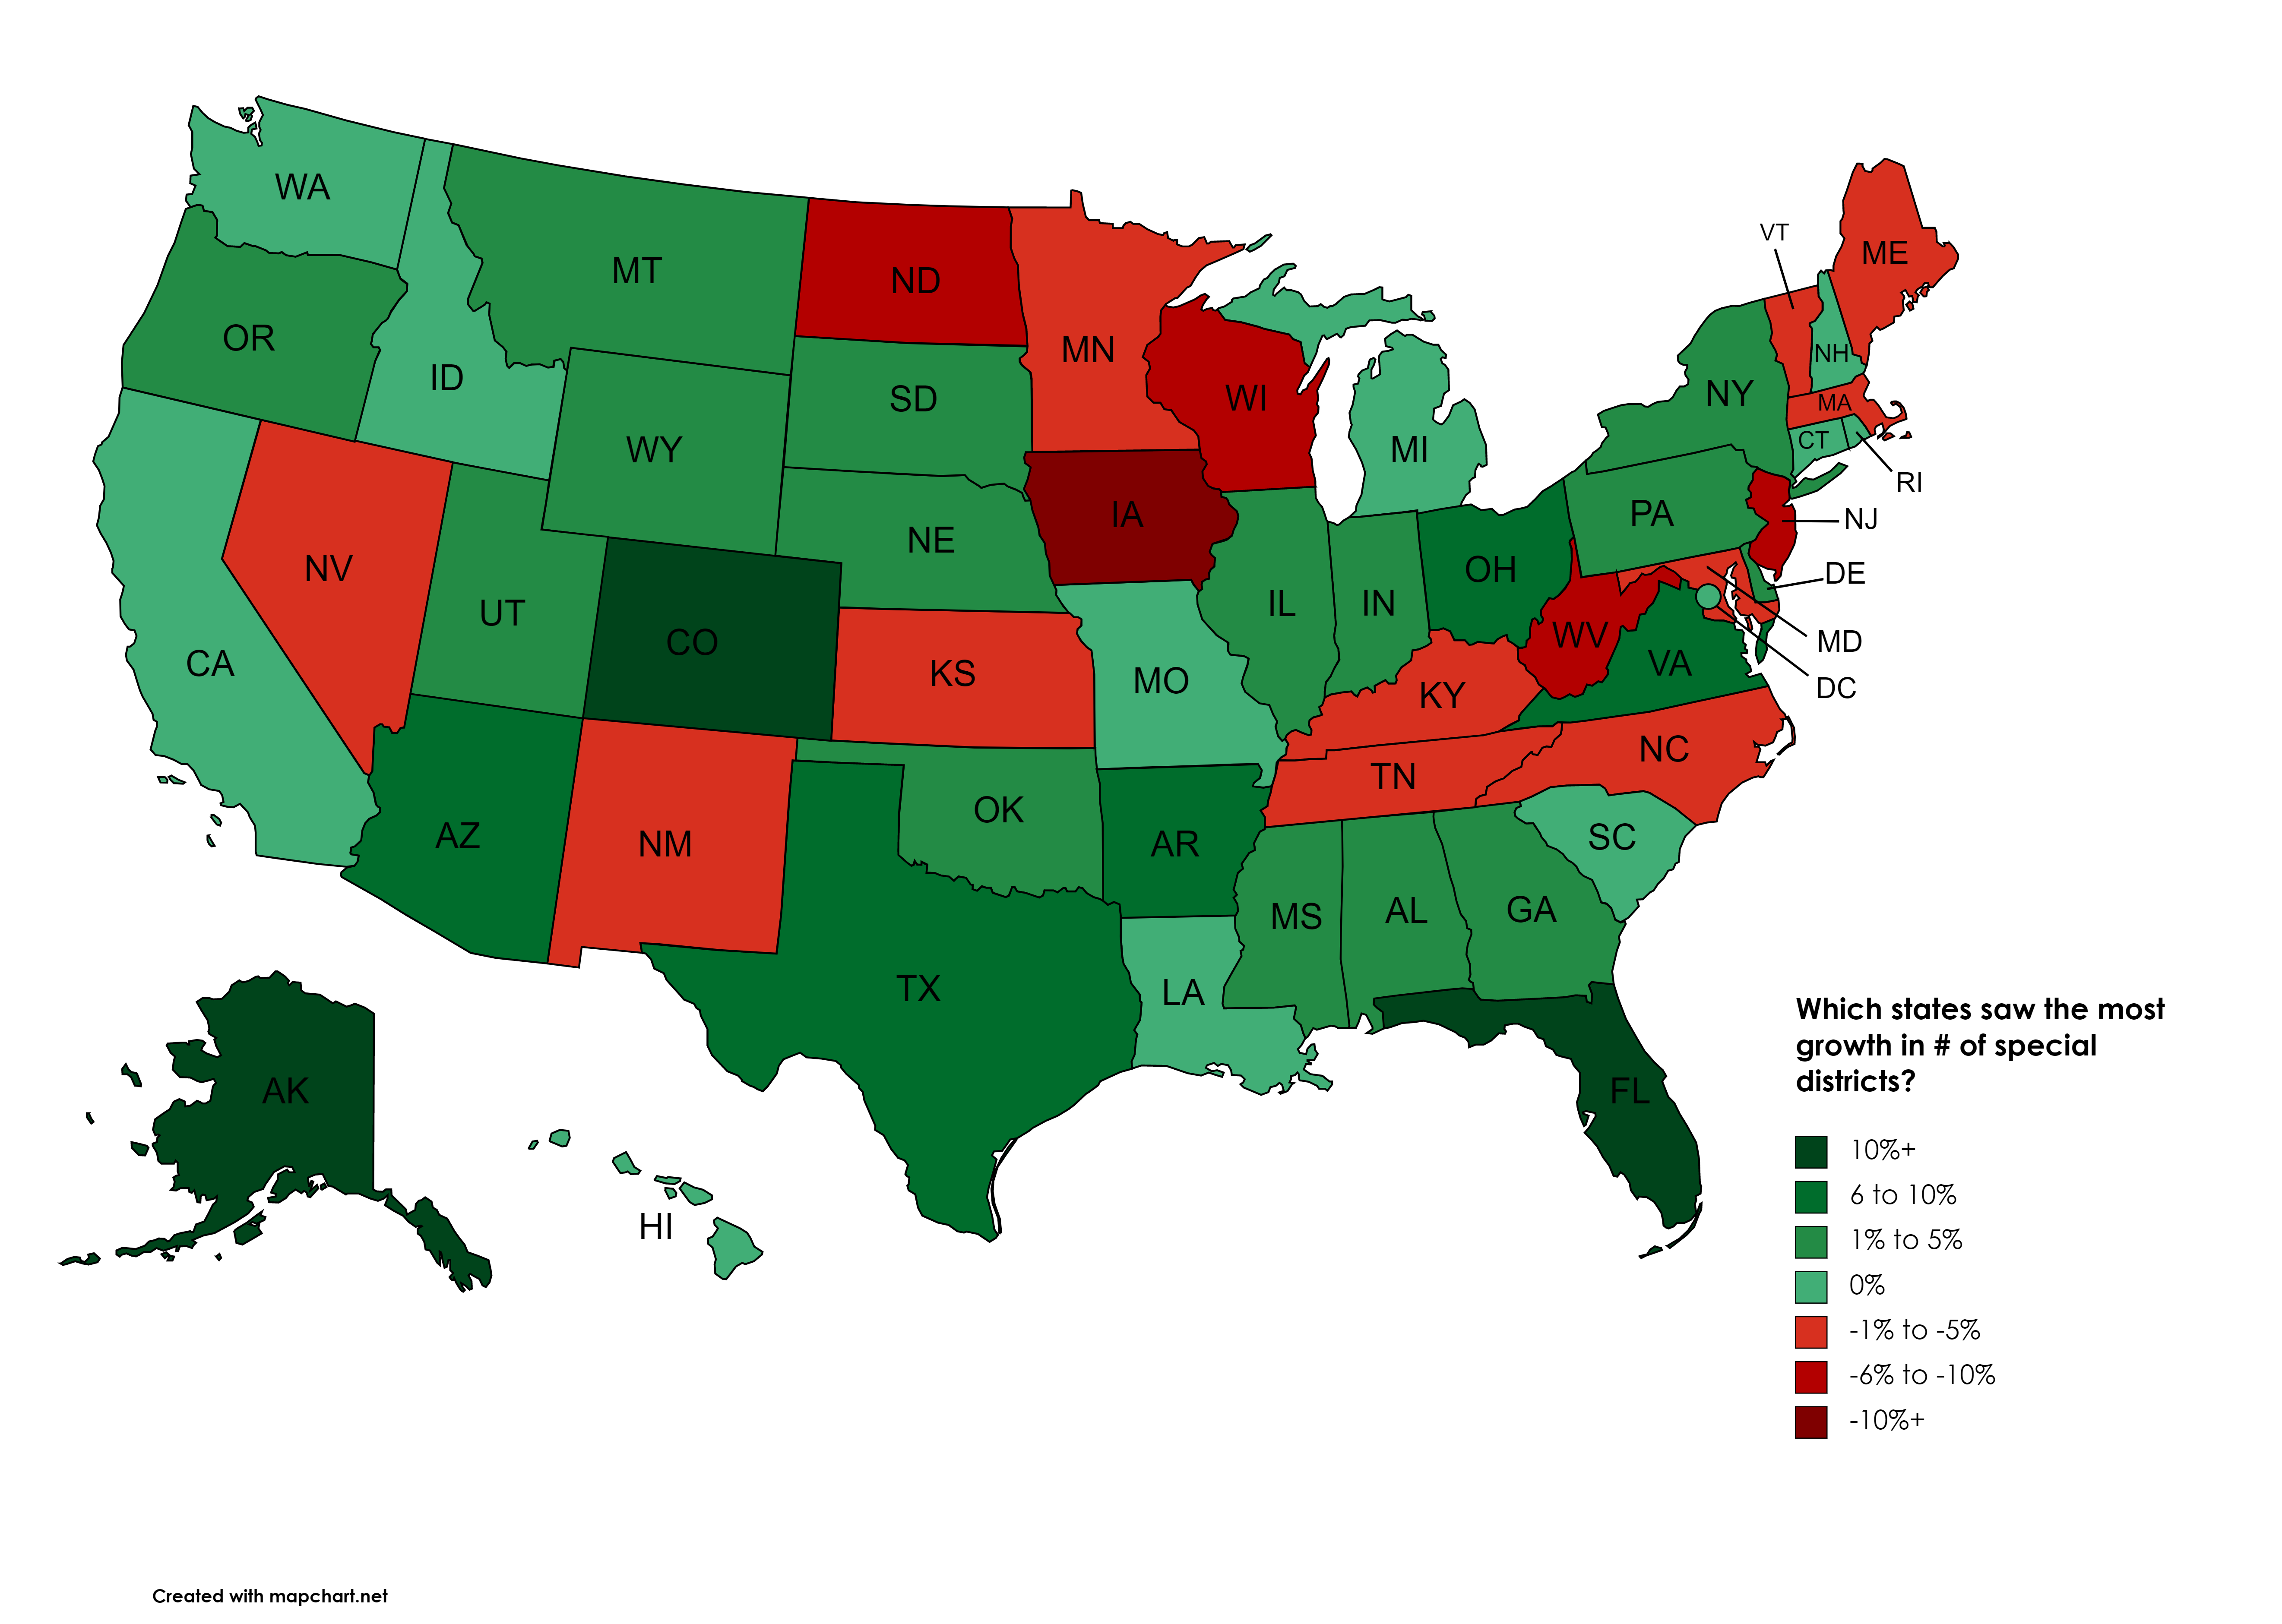
While the number of Special Districts has increased since 2017, this story of growth has unfolded differently in each state. States like Colorado and Florida saw their district count grow by 17% and 13%, respectively. On the other hand, Iowa experienced a decrease in special districts of -13%. Overall, special districts are quite stable in the US with the vast majority of states growing or shrinking their count by 5% or less, and as we mentioned in our previous post, the US has experienced a healthy overall gain of 800 new districts since 2017.
Map: District Growth by State (2017-2022)

Is Iowa really "draining" (pun intended!) special districts?
Special districts tell the story of what's most important to each state and county. Iowa is flat but can also get a lot of rain, which is why they have numerous Drainage Districts. These districts are formed, operated, and paid for by a relatively small number of property owners - usually farmers. The count of Drainage Districts fell from 123 in 2017 to 18 today, according to the US Census, which is the main driver of Iowa's apparent drop. These tend to be very small districts that don't even have websites, so we suspect there was a change in how the Census counts these districts.
Housing developments drive district growth in CO & FL
Colorado and Florida experienced tremendous growth in their count of special districts between 2017 and 2022. This is largely due to the increase in Multi-function Districts, as we highlighted in this recent post. Many new communities are forming special districts as a way to provide services new developments need like electrical service, irrigation for landscaping, and maintenance of special features such as a lake. This is an interesting use of special districts that we will keep our eye on.
Special districts remains stable, continue to adapt
Overall, we saw the number of special districts remain stable. District types such as fire, water, recreation, health, utilities, education, etc. were the most stable with very few changes across states. Special districts are a mature local form of government. Constituents know which services they need and have found districts typically do a good job of delivering on that promise!
*all data comes from 2012, 2017, and 2021 U.S. Census Bureau reports